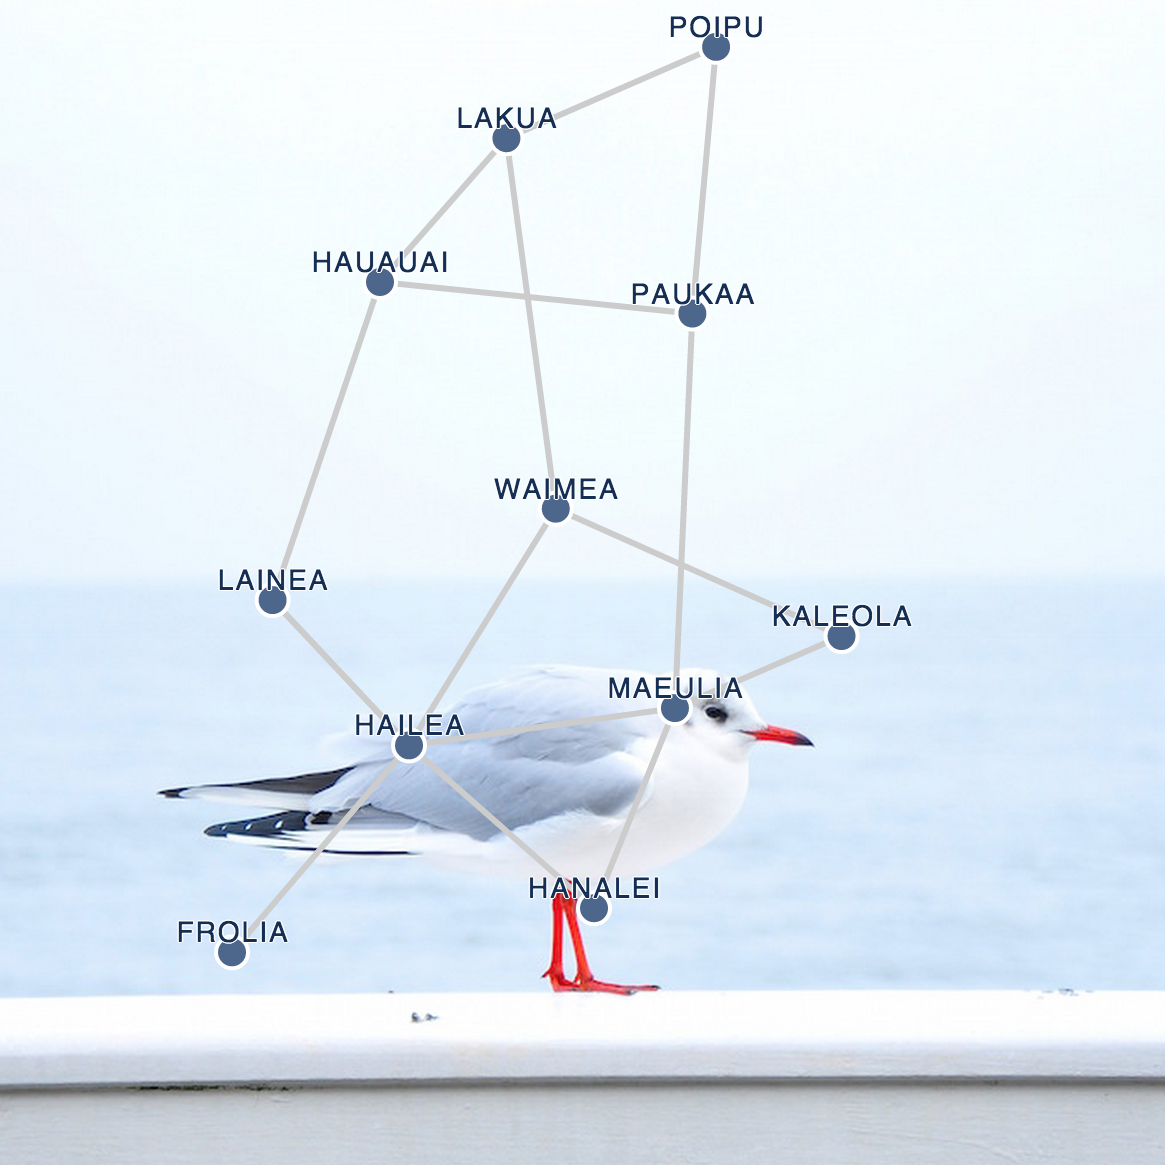
Remote Island Train Map
d3 Directional-Force Map
Challenges
- I had previously worked with d3 for simple plot graphs, pie charts, bar charts
- Had never worked with more advanced d3 implementations, including force charts
- Had not worked with SVG markers, defs, or hover effects
Process
- Was familiar with how d3 uses data to generate coordinates, so basic line-node graph was completed within 2-3 hours
- Refactored provided data into array of cities and a way to populate nodes and reference links for much cleaner and easier to read code
- Spent about 4 hours learning and attempting arrowhead markers on lines, and associating labels with them
- Eventually refactored code to first generate svg groups that hold line and marker so that the fill/stroke colors could match
- Spent (mumble) hours on attempting shortest path implementation, reading about Dijkstra's algorithm, and experimenting with online d3 dijkstra examples
- Was unable to get shortest paths working
Lessons Learned
d3 Force
- This was entirely new, so all implementation was an experiment
- Had a lot of fun digging through various source code of online examples
- Sometimes nodes showed and no lines! Sometimes lines showed and no nodes! Figuring out why helped me understand what Force was doing on a deeper level
- Some references used include:
SVG
- SVG markers do not inherit line color. Refactored code generating connection lines as groups holding the line and marker to manipulate highlight color effect.
- Leveraged these groups to add line titles as hover tooltips showing distances
- Some resources used include:
Shortest Path
- Spent most of my time down a rabbit hole reading source code and attempting this stretch goal
- Was unable to crack Dijkstra's algorithm or get various examples online working with my implementation
- Some references used:
- Demonstration of Dijkstra's shortest path algorithm
- Was the most promising, ran into difficulties with generating an Adjacency Matrix
- Dijkstra's algorithm in Javascript/D3
- Only changes line color based on distance, doesn't actually return the shortest distance between nodes
- Simple Dijkstra Implementation in JavaScript
- Was using this example to develop a recursive shortest-path approach of my own when I realized I had used up all of my time!
- Demonstration of Dijkstra's shortest path algorithm
Background image via unsplash